When working on a .NET project, you are highly likely to use custom objects. When you start debugging your code, you can see them in the debugger. However, the default way these objects are displayed by the debugger is not very handy nor developer friendly. You are probably interested in the identifying properties of your custom object rather than the name of your class.
Example program
Note: The example program is using top-level statements, so you will not see any namespaces or method body. To learn more, check out: https://docs.microsoft.com/en-us/dotnet/csharp/whats-new/tutorials/top-level-statements
Consider the following program:
| |
When you set a breakpoint on line 4, the custom object will be displayed in the debugger like this:
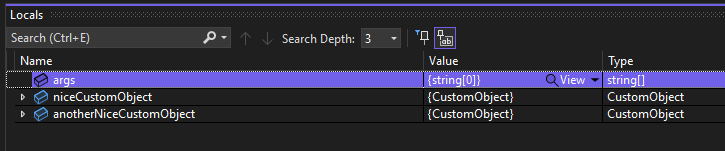
That isn’t helping! It would be much nicer to see the name of the custom object right away, so we can easily distinguish between different objects of the same kind.
Implementing the DebuggerDisplayAttribute
Lucky for us, we can use the DebuggerDisplayAttribute available in .NET. We can put it above our class and provide a string argument containing the template we want to use for displaying object instances in the debugger. The string is evaluated as the name of a field, property, or method.
In our case, we use the Name field so we can easily identify each object instance.
| |
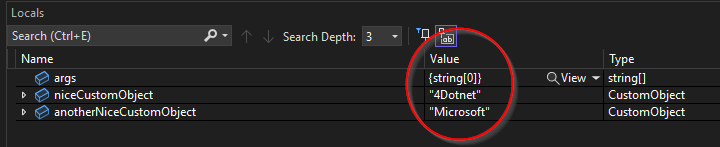
And no surprise here, we can now see the value appear in the debugger:
Conclusion
Using this simple attribute, we can debug complex classes much easier by simply telling the debugger how we want it to display objects. To learn more about the specifics of the DebuggerDisplayAttribute, check out: https://docs.microsoft.com/en-us/visualstudio/debugger/using-the-debuggerdisplay-attribute?view=vs-2022